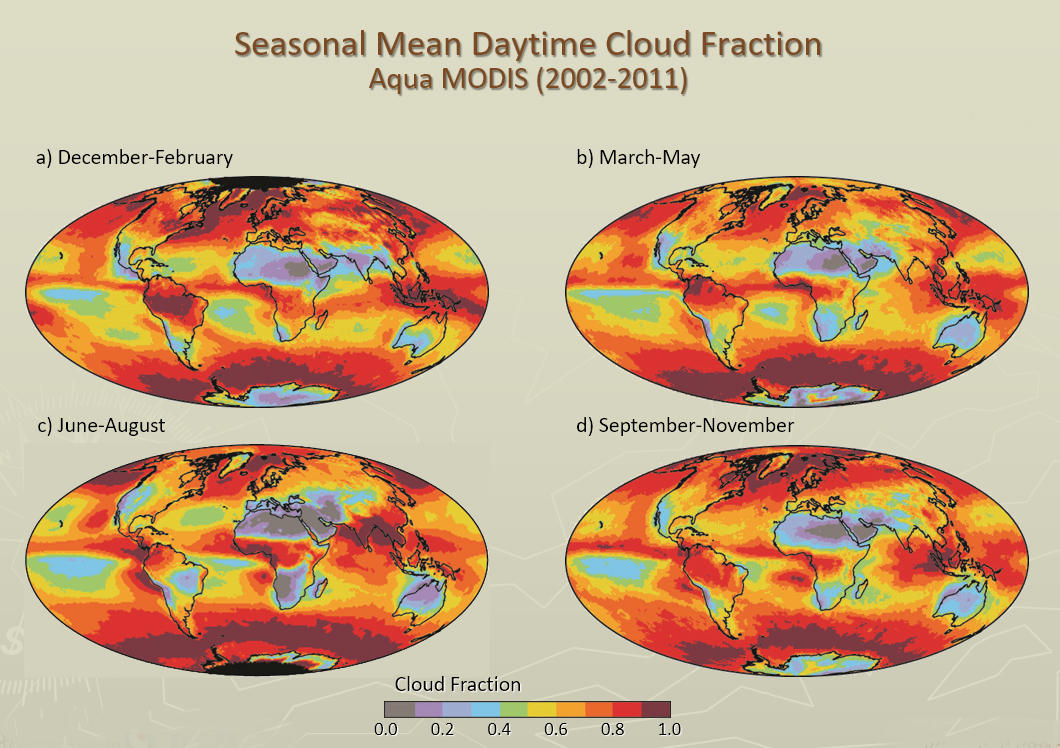
Below are some sample images from the MODIS L3 Monthly (08_M3) Product. Data shown was post processed to show seasonal means over a multiyear period. The parameter displayed is Cloud Fraction derived from the Cloud Mask for daytime.

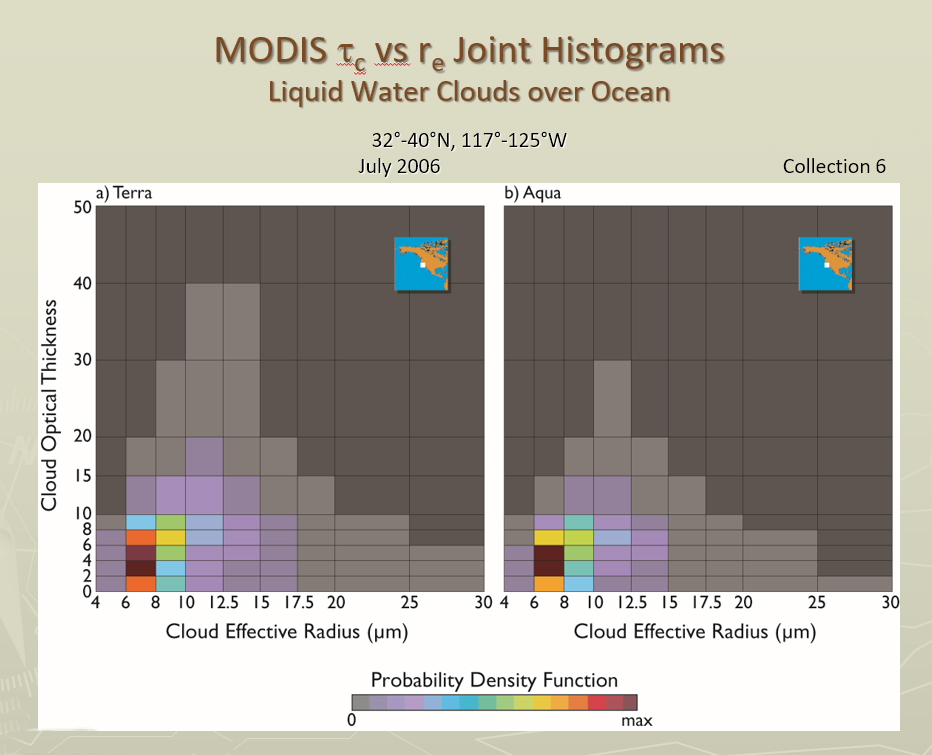
Shown below are Joint Histograms of Cloud Effective Radius vs. Cloud Optical Thickness for a small region in the stratocumulus region off the California Coast for July 2006. The raw pixel counts were converted to a Probability Density Function, which takes into the account the reliatve sizes of the various bins.


