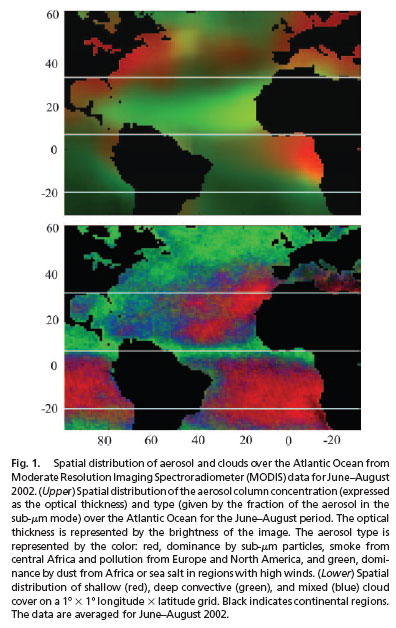
Spatial distribution of aerosol and clouds over the Atlantic Ocean from Moderate Resolution Imaging Spectroradiometer (MODIS) data for June-August 2002 (Upper) Spatial distribution of the aerosol column concentration (expressed as the optical thickness) and type (given by the fraction of the aerosol in the sub-um mode) over the Atlantic Ocean for the June-August period. The optical thickness is represented by the color: red, dominance by sub-um particles, smoke from central Africa and pollution from Europe and North America, and green, dominance by dust from Africa or sea salt in regions with high winds. (Lower) Spatial distribution of shallow (red), deep convective (green), and mixed (blue) cloud cover on a 1x1 longitude x latitude grid. Black indicates continental regions. The data are averaged for June-August 2002.