Equal Angle Grid
The MODIS Atmosphere Daily Global Product is stored on an equal angle lat-lon grid. The grid cells are 1 degree by 1 degree, which means the output grid is always 360 pixels in width and 180 pixels in height.The major implication of this relative low grid resolution is these product maps are not good candidates for printing, however they are fine for viewing on video monitors as well as for model input. The first (upper left) grid position (1,1) corresponds to a 1 degree box centered at latitude 89.5 and longitude -179.5. The convention used here is positive latitudes are degrees north and positive longitudes are degrees east, allowing lat/lon pairs to increase from top to bottom and left to right on the grid. Therefore, the first grid (1,1) corresponds to a 1 degree box centered at 89.5N and 179.5W.
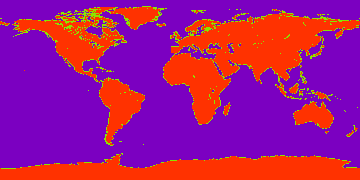
Land/Ocean Mask
A Land/Ocean Mask for L3 products is provided below. The PNG image is 360 pixels in width and 180 pixels in height. Each image pixel corresponds to one L3 1x1 degree grid cell. Values of 200 represent land grid cells, values of 100 represent mixed grid cells, and values of 0 represent ocean grid cells. This image can be use with analysis programs, such as those written in IDL, to screen L3 results for ocean or land only.
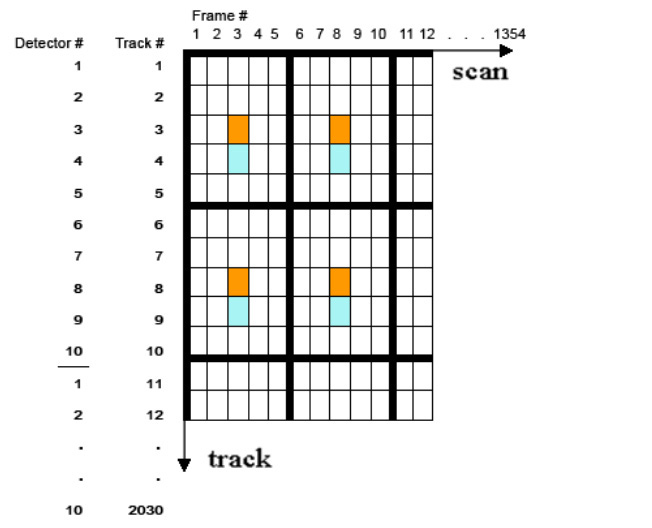
Sampling modification to avoid dead detectors (starting in Collection 5)
A software modification was introduced in Collection 5 (introduced in calendar year 2008) and continued forward into future Collections, which offset slightly the L2 data point sampled. This patch only impacts L3 data that are derived from sampled L2 data and includes: Water Vapor (05_L2), Cirrus Detection and Cloud Optical Property (06_L2) parameters, all of which are computed and stored at 1 km resolution in the L2 files but are sampled at 5 km resolution for computation of L3 gridded statistics. In these cases, the geolocation matches the 1-km area corresponding to the orange square in the figure below. This corresponds to the 1-km pixel located in column 3, row 3. However, the actual L2 data are sampled from the blue square (1 km pixel located in column 3, row 4). In other words, L2 data from MODIS detectors 4 and 9 are sampled (instead of detectors 3 and 8) in the 10-detector set. This patch was necessary because in some critical MODIS spectral bands on the Aqua platform, detectors 3 and 8 both died (that is, always contained missing data); so a shift to adjacent detectors was necessary to prevent many sub-sampled products from being completely missing (fill values) in L3.
Definition of Day change between Collection 5/51 and Collection 6
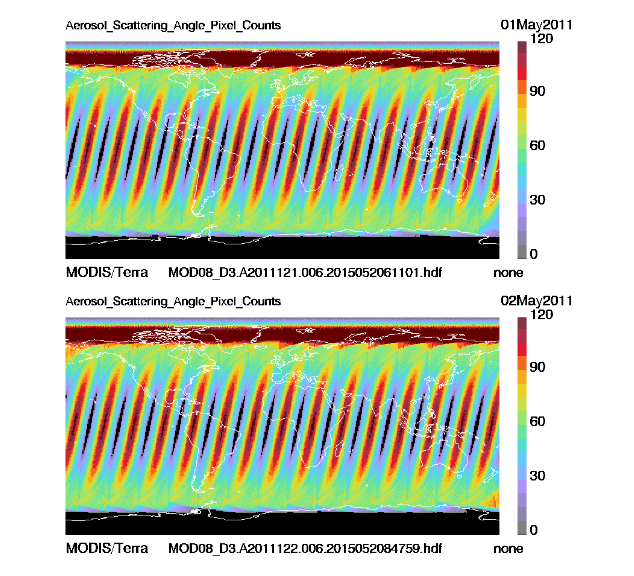
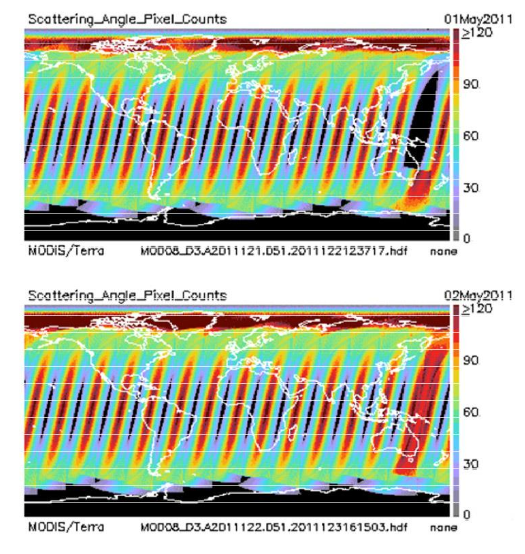
The use of the hardwired 24-hour (00:00:00 to 23:59:59) UTC time stamp interval to determine a “data day” in Collection 051 and earlier caused two troublesome problems. First there was an every other day repeating pattern seen in the L3 Daily (08_D3) data/images. This pattern showed an apparent “data gap” on one day, where there appeared to be missing granules or sometimes a missing orbit near the International Date Line. Then on the subsequent day there was “data overlap”, where the “missing” granules from the previous day were mixed in with the granules from the new day – effectively combining data observed nearly 24 hours apart to be averaged together. This can be seen in the Figure below.
The next Figure shows the same two days of data, except using Collection 6 data, which had the new C6 “Definition of Day” update applied – effectively repairing (eliminating) the problem. The fix was done by selectively adding in or removing granules from the 3 hours prior to the start of the data day or 3 hours after the end of the data day -- then using the 180 longitude line as a screen (for the daytime node or the 0 longitude line as a screen (for the nighttime node).