Tracking of known problems and subsequent fixes is an important issue for MODIS data users. This page will act as a repository of all known MODIS Atmosphere Data Product problems, as well as how to determine the problematic version (and the fixed version) of the HDF data -- therefore data users should check this page for updates regularly. Data Users unfamiliar with how to properly track problems and fixes by determining the version of their downloaded HDF files should refer to the documentation in the Introduction sublink (the top link along the LHS of this page).
Note that a checkmark (✔) in the tables below means Data Issue or Quality Statement applies. A blank means it's been fixed or does not apply.
Monthly Data Issues: Table of Contents & Anchor Links
(Note: Anchor Links point to a specific place within this page.)
| Collection/Platform where Issues Apply | ||||||
|---|---|---|---|---|---|---|
| Issue | Impact |
C6.1/Terra |
C6.1/Aqua |
C6.0/Terra |
C6.0/Aqua |
|
| #1. Input L2 Problems propagate downstream |
L |
✔ |
✔ |
✔ |
✔ |
|
| #2. CT Day Granules misplaced to Night |
L |
✔ |
✔ |
✔ |
✔ |
|
| #3. 1km CTP Low Ocean in December |
M |
|
|
✔ |
✔ |
|
| #4. Dateline Discontinuity Cld Mask Cld Fraction |
L |
✔ |
✔ |
✔ |
✔ |
|
Daily Data Quality Statements: Table of Contents & Anchor Links
(Note: Anchor Links point to a specific place within this page.)
| Collection/Platform where Quality Statements Apply | ||||||
|---|---|---|---|---|---|---|
| Quality Statement | Impact |
C6.1/Terra |
C6.1/Aqua |
C6.0/Terra |
C6.0/Aqua |
|
| #1. Missing Pixel Count SDS for CTH |
Q |
✔ |
✔ |
✔ |
✔ |
|
Issue #1: Problems in input Aerosol (04_L2), Water Vapor (05_L2), Cloud (06_L2), Atm. Profile (07_L2), and Cloud Mask (35_L2) propagate into downstream products
 Description: See the Known Problem pages for the input (upstream) Level-2 products 04_L2 (Aerosol), 05_L2 (Water Vapor), 06_L2 (Cloud), 07_L2 (Profiles), and 35_L2 (Cloud Mask) by clicking on the links to the left. Users should make themselves aware of any issues in the upstream data products.
Data Dates Affected: Issues could occur for any date
Affected Platform: Terra and Aqua
Collections Affected: Issues possible in all Collections
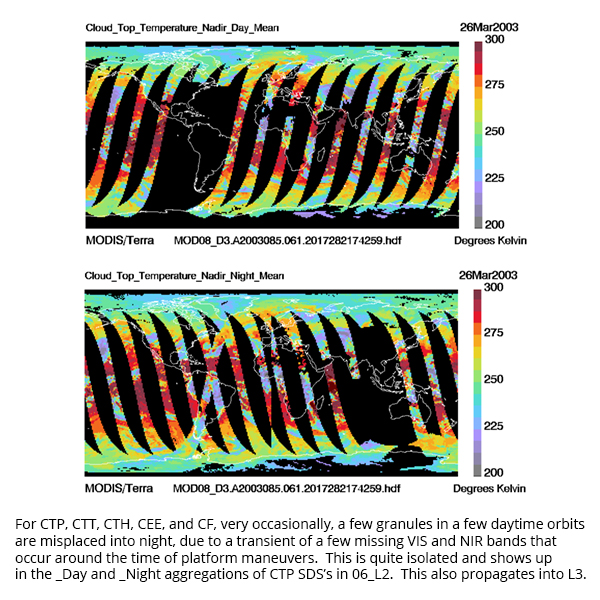
Issue #2: Very Intermittently occurring Cloud Top Property Granules misplaced from Daytime to Nighttime
 Description: Very occasionally, a few daytime granules are misplaced to the nighttime SDS's in 06_L2. This misplacement seems to be correlated with satellite maneuvers which occur for very brief periods (minutes) on a one to two month schedule. This problem is isolated to any 06_L2 SDS which has the suffix "_Day" or "_Night" (which corresponds to a few Cloud Top Property parameters). The upshot is for users reading any _Day SDS in L2, there will be a few isolated missing granules, and any user reading any _Night SDS in L2, there could be a few cases where day granules are overlapping the night granules. This is occurring in less than 0.001% of the time. To bypass this issue, users can read the un-aggregated L2 SDS's and do the D/N aggregation using the Cloud Mask D/N Flag if needed.
PGE Versions & Production Dates of Problematic & Corrected Data:
Data Dates Affected: Can occur anytime, but very intermittent and very limited in scope
Affected Platform: Aqua and Terra
Collections Affected: All Collections
Additional Documentation: View PDF (shows how this L2 error impact L3)

Issue #3: Problem in C6.0 1-km Cloud Top Pressure (Low) over Ocean in December
 Description: A bug was discovered in the Collection 6.0 1-km cloud top pressure low (low in the atmospheric layer, i.e. close to the Earth's Surface) over ocean algorithm for both Terra and Aqua. Low Atmosphere Cloud Top Pressure (> 600 hPa) retrievals for all oceanic L2 December data are not consistent with those of the other months and are considered to be incorrect. The impact will also be seen in daily, 8-day, and monthly L3 data, where 1km CTP data is ingested, Note that this issue was corrected in Collection 6.1 data.
PGE Versions & Production Dates of Problematic Data:
Data Dates Affected: Decembers from launch through 2016
Affected Platform: Aqua and Terra
Collections Affected: Collection 6.0 only
Issue #4: Dateline Discontinuity for Cloud Fraction from Cloud Mask in a specific instance
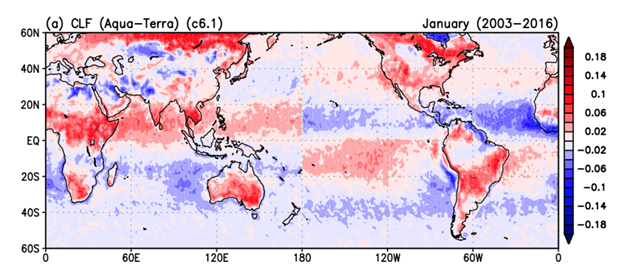
 Description: A data discontinuity at the International Dateline was detected when L3 Cloud Fraction from Cloud Mask data is manipulated in a very specific way. It should be noted that this discontinuity only appears in this single L3 Atm SDS Cloud_Fraction (Cloud Fraction from Cloud Mask for D+N combined). What follows is more detail on this anomaly:
A Summary of the C6/61 Discontinuity Analysis:
Clearly this unusual discontinuity signature in the L3 Atm data (seen at 0 and 180 longitude) appears to require a number of specific conditions to intersect:
1. Day+Night Combined (there are no anomalous signatures seen in day only or night only)
2. Aqua–Terra or Terra-Aqua (no anomalous signatures seen when using a single platform)
3. Time periods 1 month or longer to more clearly see (it’s still there in shorter periods though)
4. Impacted science data must include clears (clear sky), such as cloud fraction
5. It appears likely to need the C6 Defn of Day adjustment with hard linear cut-offs at 0 and 180 longitude
This combination of conditions is only possible in the Cloud Fraction from Cloud Mask parameter for Day+Night and only if Aqua-Terra or Terra-Aqua is being viewed; and not possible in any other parameter, which is why we only see the discontinuity there (in that single case).

The discontinuity at 180 longitude (and also at 0 longitude) only shows up in a single SDS (Cloud_Fraction); and requires several conditions to intersect: a.) Combined D+N, b.) A-T or T-A differences, and c.) Science data must include clears (clear sky).

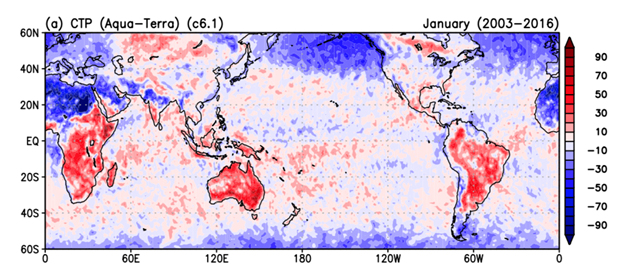
A sample of the same difference analysis done on an SDS (Cloud Top Pressure) where all 3 required conditions were not met. The missing condition in this case is the science data did not include clear sky data. Meanwhile the other 2 conditions were met (Combined D+N and A-T or T-A differences). However all it takes is one missing condition of the three required for the discontinuity to disappear.
When Gala Wind leaned into this issue over a year ago, it appeared that the Pixel Count data had an impact on the science data in the relevant case (Cloud_Fraction), where she saw a marked signature in the Pixel Count Data, with striking PC discontinuities at 0 and 180 longitude. It’s not intuitively obvious why this systematic pattern in the Pixel Count data seems to influence the actual Cloud Fraction data, but clearly it does. I believe it might have something to do with the fact that clears are included in this parameter. So perhaps in regions of unusual pixel count patterns (with discontinuities at 0 and 180 longitude), the final CF product has the “opportunity” to pick up many more data points and the pixel count data begins to exert more influence. I am not 100% sure about that though, but that is one possible guess.
This is a perplexing problem, but definitely isolated in a single parameter the Cloud Fraction from Cloud Mask and ONLY if you look at Day+Night AND only if you difference the two platforms. It does become more obvious if you look at time frames longer than 1 month (like multi year differences).
I don’t see any simple way to solve this and keep a definition of day adjustment. Seemingly, if we reverted back to the 0000 to 2400 UTC Defn of Day, this issue would tend to “smear out”, since the “edges” of the data will be jagged for each daily time period. So, there will not be a hard linear signature that follows a longitude meridian. The good news is, this only appears in a single parameter, and you have to combine the data in a specific way to see it.
The upshot to this resurrection of this analysis, is the data discontinuity issue will NOT affect Aerosol (or Cloud Optical for that matter) since those algorithms are daytime only. Therefore, this dateline discontinuity issue is not a valid reason to deny the Aerosol Dark Target team their consideration of continuing the C6 Defn of Day Adjustment into C7.
PGE Versions & Production Dates of Problematic Data:
Data Dates Affected: All data dates
Affected Platform: Aqua and Terra combined
Collections Affected: Collection 6.0 and 6.1
More Detailed Information: PDF
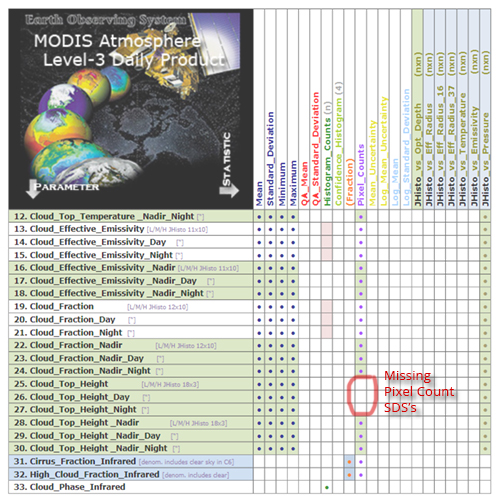
 Quality Statement #1: Pixel Count SDS not defined for Cloud Top Height (CTH)
Description: In D3, E3, and M3, the Pixel Count SDSs for the full swath Cloud Top Height (CTH) are not defined (i.e., are missing); note that the Pixel Count SDSs are defined for the Nadir CTH scalar SDSs (see the figure below). This was an oversight in C6/C6.1 development, and breaks the “SDS inventory symmetry” in L3 where all other Cloud Top Property related parameters have Pixel Count SDSs defined. The missing CTH Pixel Count SDSs are not particularly problematic since users can obtain these counts from the CTH Joint Histograms. Note that the upper bin limit of CTH of 18,000 m. does capture all the L2 CTH data which is capped at 18000. This oversight is expected to be remedied in future Collections.

Data Dates Affected: All Data Dates
Affected Platform: Terra and Aqua
Collections Affected: Collection 6.0 and Collection 6.1

